Candlestick Financial Analysis Trading Chart - Stockillustratie
Candlestick chart financial chart used to illustrate price movements of a security, derivative, or currency showing open, close, high price and low price for each day over a specified period of time. EPS 10 file. Transparency effects used on highlight elements.

Bestel uw ingelijste foto direct en bekijk de diverse opties op Photos.com.
LICENTIE KOPEN
Alle royalty free licenties bieden wereldwijde gebruiksrechten en uitgebreide bescherming. Daarnaast zijn er eenvoudige tarieven met volumekortingen beschikbaar.
€ 335,00
EUR
Getty ImagesCandlestick Financial Analysis Trading Chart, Stockfoto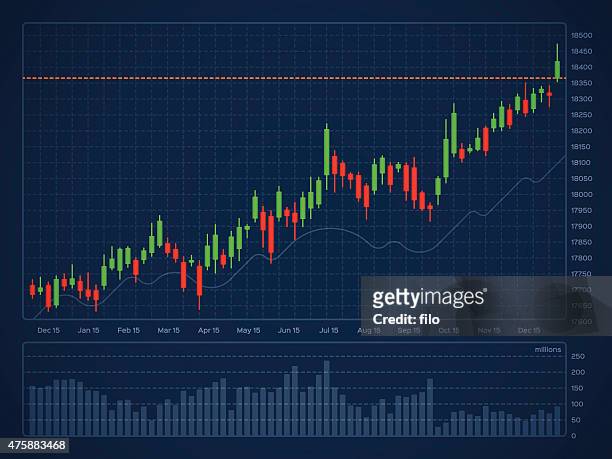 Download premium, authentieke Candlestick Financial Analysis Trading Chart stockillustraties van Getty Images. Verken vergelijkbare stockillustraties met hoge resolutie in onze uitgebreide visuele catalogus.Product #:475883468
Download premium, authentieke Candlestick Financial Analysis Trading Chart stockillustraties van Getty Images. Verken vergelijkbare stockillustraties met hoge resolutie in onze uitgebreide visuele catalogus.Product #:475883468€335€50
Getty Images
In stockGEGEVENS
Credits:
Creatief nr.:
475883468
Soort licentie:
Collectie:
DigitalVision Vectors
Max. bestandsgrootte:
4711 x 3533 px (28,22 x 21,16 cm) - 424 dpi - 3 MB
Datum van uploaden:
Release-informatie:
Geen release vereist
Categorieën:
- Effectenbeurs,
- Tabel,
- Grafiek,
- Koersinformatie,
- Kandelaar,
- Financiën,
- Handelen,
- Computergrafieken,
- Klimmen,
- Analyseren,
- Print,
- Lijngrafiek,
- Groei,
- Spaargeld,
- Globaal,
- Illustratie,
- Internationaal bedrijf,
- Investering,
- Vectorafbeelding,
- Staafgrafiek,
- Wisselkantoor,
- Wisselkoers,
- Bedrijfsleven,
- Diagram,
- Gegevens,
- Geld verdienen,
- Uitwisselen,
- 2015,
- Bankieren,
- Financieel item,
- Geld,
- Kopen,
- Rijkdom,
- Succes,
- Verkopen,
- Vooruitgang,
- Winkeldisplay,